

Project at a glance
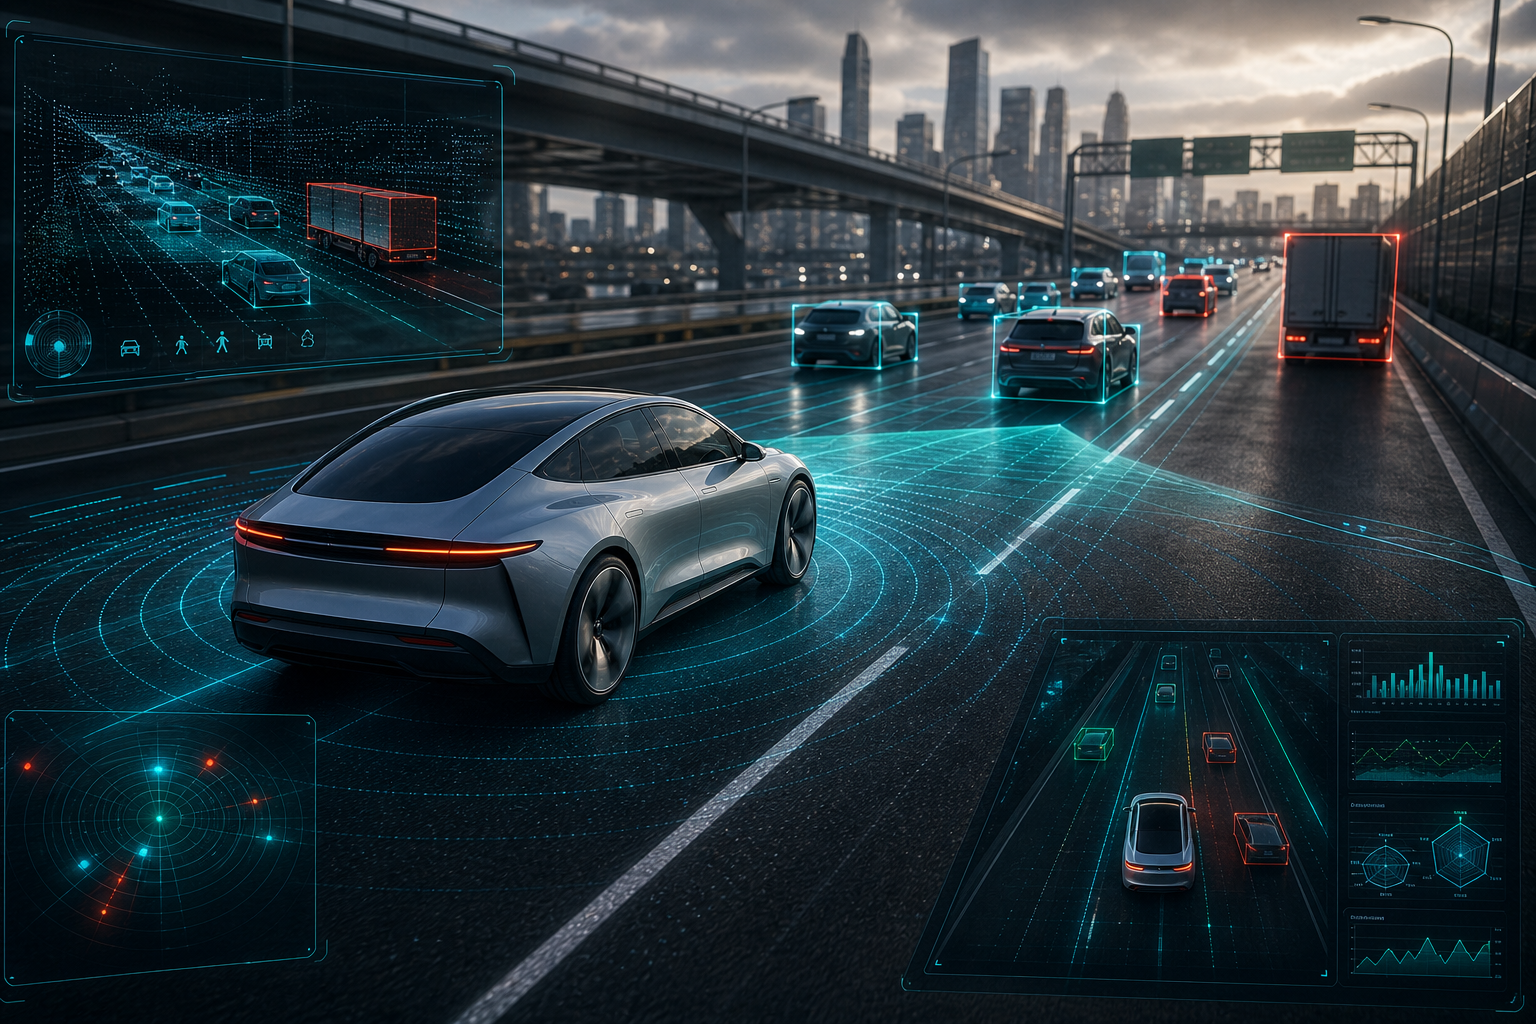
This published project combines two complementary lanes of work. The first lane is a vehicle object-detection workflow that compares several modeling strategies before selecting YOLOv8n as the final detector. The second lane is a Tesla autopilot fatality analysis that cleans and explores the crash dataset to surface yearly, geographic, and outcome patterns.
Problem Statement
The object-detection lane asks me to identify vehicles in road-scene imagery and localize them with bounding boxes. The analytics lane asks me to inspect the Tesla fatal crash dataset and explain patterns related to dates, locations, deaths per event, and verified autopilot involvement.
I preserved the full model trial history in the notebook so visitors can see the real decision path from baseline regressors to a true object detector instead of only seeing the final answer.
Why This Project Matters
Multiple model trials
The notebook keeps the custom CNN baseline, the MobileNetV2 transfer attempt, the full-annotation benchmark, and the final YOLOv8n detector visible for real side-by-side review.
Headerless labels explained
The project documents that the Part 1 labels file has no headers and explicitly interprets each row as image_id, label, xmin, ymin, xmax, ymax.
Modeling plus analytics
The final page shows both deep-learning workflow decisions and a second analysis track built around exploratory data analysis and reporting.
Final Model Selection
I tested several approaches and selected YOLOv8n as the final image detector because it behaves like a real object detector instead of collapsing toward center-biased single-box predictions. The complete-annotation model is still useful in the notebook because it preserves the full bounding-box dataset even when every local image is not present.
Why YOLO wins
YOLOv8n gave the best structural fit for the assignment by producing true detection outputs and avoiding the center-box collapse behavior that appeared in the simpler single-box regressors.
Prediction Evidence
The baseline detector output is useful because it shows the earlier limitations, while the YOLO grid shows the stronger final object-detection behavior.
Single-box regressor output

Green boxes represent the labeled bounding boxes, while red boxes represent the baseline model predictions.
YOLOv8n prediction grid

The final detector is presented as a separate saved grid so visitors can compare the stronger detection behavior directly.
Tesla Safety Analysis Highlights
The second half of the project focuses on data cleaning and exploratory analysis rather than predictive modeling. It explains where fatal events occur, how they change over time, and how often verified autopilot deaths appear in the cleaned records.


